Showing posts with label oil. Show all posts

Thursday, February 2, 2012

BEFORE THE BELL-LOOKING FOR CONFIRMATION UPDATE FEB 2ND

Let me preference this write up by saying I approach my charting objectively. I do not watch CNBC or any other stock program. No matter what the stock market did on any given day, I view my charts with NO EXPECTATION.

I review a list of 50 ETFs and 10 Name Brand Stocks daily.

The following ETF's are major pillars of stock market bull success. To confirm a rally and be confident, these ETF's should also confirm.

I. DDM-Proshares Dow

A. So far in the new year, we can clearly see a ramp on volume compared to the previous months. This ramp in volume as resulted in a LOWER HIGH for DDM, a black spinning top today, in what I am sure was a praised BULL DAY on the TV Shows.

B. The 20 day moving average is closing fast the gap created by Santa

C. RSI<2> is making lower highs

D. On Balance Volume, which measures the positive volume on up days, verses the negative volume on down days, has COLLAPSED below its 20 day moving average.
II. IYT Transports

A. Bookend Change of Direction DOJI has emerged

B. Lower Highs RSI<2>

C. OBV remains positive

D. Consolidation or Distribution at the Volume by Price Indicator-yet to be determined

III. OIL ETF-daily

A. Oil and the DOW have diverged. They were both moving same direction until 2012. Which is correct?

B. OIL weakness despite the drum beat of war with IRAN-signaling a resumption of bad economy and lower demand

C. Extremely bearish deliberation moving below previous volume by price support

D. Volume by price is confirmed resistance now

E. OBV collapse

IV. OIL ETF-weekly

A. Suggested distribution box that began in late November; currently 3 months strong.

V. SSO-S&P Ultra daily

A. On a big rally day, SSO formed a Bearish High Wave-loss of direction. This was formed as a lower high.

B. RSI lower highs

C. OBV 20 day gap has been closed.

VI. TMF-20 year T-bill

A. Divergence from Dow

B. Double top formed between Jan 17th and today.

C. Despite stock rally, Bearish Harami formation

D. OBV move above 20 sma denied

VII. UST-7 and 10 year Treasury

A. Divergence from Dow

B. Bearish Harami

C. OBV has collapsed

Conclusion:

Next week is 180 day completion on 360 yearly cycle. Yesterday I noted on Twitter many Parabolic Sar sell signals. Today, these charts again provide NO COMPELLING REASON to be long the major indexes.

Therefore, our strategy of long HIGH RISK mojo stocks like NFLX and potentially CROX and GMCR, along with slowly averaging into TVIX for the eventual market sell off continues. (Side note, RUSSIA is looking good as alternative investment to USA)

Tim Kathlina


Wednesday, January 11, 2012

AFTER THE BELL-OIL TO $120, SPY, EURO/DOLLAR UPDATE JAN 11TH

ZeroHedge Jan 11th-Iran Interest Rates Raised To 20% To Fight Hyperinflation; Iran Nuclear Scientist Killed In Street Bomb Explosion.


Americans will not support an invasion of Iran without provocation by Iran. History is well documented that governments in order to achieve an objective will create circumstances, under the radar, to pressure an identified enemy to make the first attack.

As FDR did enticing Japan to attack Pearl Harbor, George Bush urging Saddam to attack Kuwait, Obama is now boxing Iran in to entice them to attack US interest. Nothing helps re-election like war; foreign and domestic: Oklahoma City-Bill Clinton, 911-George Bush, Iran-Obama.

Looking at Light Crude, the daily chart seems to have an Inverted Head-n-Shoulders pattern. IF this pattern breaks the neckline upward, then the calculated upside is between $110-$120. If this breaks the neck line based on Iran/US military encounter, sky is the limit. Either way, as of today, it seems the path of least resistance for OIL is HIGHER.


December thru many fund managers under the bus because the decoupling of the Euro from the S&P. Prior to December, fund managers could count on the currency to move lock step with the US index. The majority of fund managers missed the 1290 S&P upside that we called for due to this decoupling.
Looking at the Euro, the chart looks to be in a bear wave 3 on the daily chart. I project the ending of this 3 wave between $123-125. Generally a 3-wave, an impulse wave, will extend 61% of wave one.

Wave one was 12 points top to bottom. 1.61%x12 is 19. Subtract 19 from wave 2-top of 142, gives us a price target between $123-125. At this price, we will buy the Euro.

Here the dollar/spx in December began running together. Again, this shows the appetite for all things US. Money will always go where its treated best.

Conclusion: Inverted H-n-S pattern in oil, plus Obama desperate to win re-election, almost ensures escalation of Iran conflict towards war, and higher oil prices. (Nothing is ever a sure thing)

For now, money is flowing into all things American, its the lesser of two evils. The question is as everyone seems to be all in USA, will the EURO bottom as we project, money move out of US stocks/US dollar; moving into EURO, GOLD, OIL, SILVER, etc? Or will a rising tide float all boats, and everything goes higher on extreme bullishness? This we do not have an answer to yet.

So, we will go long the EURO at the calculated bottom, wait for the response by US equities. Our next TVIX insurance purchase is coming within days.

Tim Kathlina

Thursday, November 17, 2011

November 17th After The Bell Review

History repeats. The eternal optimism that is Wall Street is slowly fading into desperation. As the fallout from MF Global continues to spread, duck n cover becomes the trade.

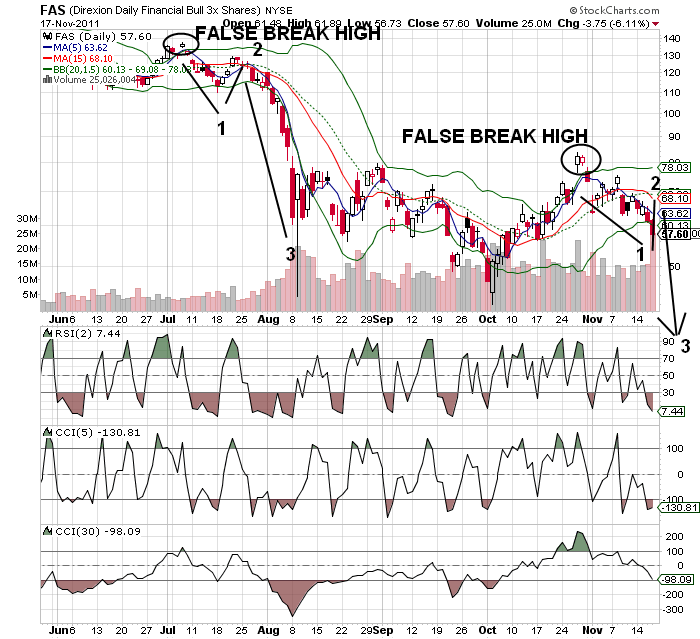
We see today looking at the Financial ETF FAS, able to blow right past the line in the sand with no problem. A repeat of July-August seems to be in the making as I have noted 1-2-3 set up. Look for financials to bully back next week up to the declining 15 day sma, before the real fireworks begin. The bulls time is about up.
Today OIL gave us sell confirmation that we talked about last week. The DOJI candle followed by a long down day selling pressure sets up the pull back. CCI(30) is still in an uptrend, so for now we are looking to see what happens at the 38% retrace line in the sand. We should expect a bounce at that level.

Tim Kathlina

Tuesday, November 8, 2011

November 8th After the Bell Trade Set Ups

The CHINA 2 verses 10 year curves are beginning to invert, pointing to a sustained and protracted economic recession in CHINA.
Looking at the CHINA Direxion 3xs bear etf: symbol YANG. We show the move to be in a confirmed uptrend as noted by CCI(30). Even though today was down, the CCI(5) moved back above the 100 line from an oversold position. Also note the Bullish (Doji) Star Pattern from today which indicates the downward energy is dissipating, The megaphone upward move suggest a recovery to challenge the 1st wave highs.
The price of oil has made and impressive 30% ramp off the bottom in the month of October. The oil short etf SCO on the weekly chart has now moved under 2 on the daily RSI(2) trade indicator. Historically, we can expect this trade to reverse sharply and outperform over the next week or more. Stocks move in 5s and 0s time frames; expect SCO to hold $40 and move higher. A severe drop in oil will also most likely indicate a top in the broader DOW and S&P indexes for some time to come.

Gold miners etf NUGT is showing multiple signs of exhaustion. Notice today we have a bearish Harami: The Bearish Harami Pattern is a sign of a disparity. “Harami” is an old Japanese word for “pregnant”. The long white candlestick is “the mother” and the small candlestick is “the baby”. This shows the bulls’ upward drive has weakened and now a trend reversal is possible. False breakouts are common patterns; notice the false break in July. CCI (30) indicates an extreme deviation from the standard moving pattern. Short below the upper black line, expect the miners to fall back into the defined trend range.


Monday, November 7, 2011

November 7th After The Bell Stock Trend Set Ups

Gold continues it's melt higher:
Gold is still in an uptrend noted in the CCI(30). RSI<2> and CCI(5) indicates an overbought condition. Candles have not given a loss of mojo signal-but note the August drop. GOLD tends to not provide a signal. Extension above upper Boilinger suggest setting a tight stop or harvesting profits.
GOLD short is in confirmed downtrend (noted CCI<30>). The divergence noted in RSI(2) verses todays closing price, indicates a potential snap back trade. Take down half position now, 2nd half after lost mojo signal in candles. Because this is downtrend-this is snap-pop trade only. Thus expect the trade to be exitied within 1-7 trading days with tight stop.
Financial Sector closed with a 5/15 bear cross-and Bearish Harami Pattern. Close outside upper bollinger, suggest potential move to lower end of the range. Since CCI(30) still is uptrending; the trade is a short below $13, expecting to cover within 1-4 trading days; tight stop above $13.10.

OIL closed outside BB today. CCI(5) showing a negative divergence. RSI(2) at 95, historically suggest underperformance in the week or weeks to follow. Because in confirmed uptrend, with no loss of mojo in candles apparent, take 1/2 half short position now, with cover stop above $26.
These are the best high probability/low risk sets ups for November 7th. Set-ups can take 1 week to play out.

Tim Kathlina