Thursday, November 24, 2011

November 25th Before The Bell

Trends tend to move in days of 9 or 13 increments; triggered by a 4 day counter trend. As noted on the SPY chart, the parabolic October uptrend moved 14 days beyond the required 4 day counter start. As of this morning, we are on day 5, of what we suspect will be 9-13 days down before a significant retrace can start.
Keep in mind we are in a 3rd wave of a 5 wave down move. This 3rd wave will be significant in scope and will have 5 sub waves within the 3rd wave until completion. In other words, after we get to 9-13 days to complete sub wave 1, expect a retrace of 1-7 days to complete up sub wave 2; before resuming the sell off into sub wave 3, etc, etc.
Tim Kathlina

Thursday, November 17, 2011

November 17th After The Bell Review

History repeats. The eternal optimism that is Wall Street is slowly fading into desperation. As the fallout from MF Global continues to spread, duck n cover becomes the trade.

We see today looking at the Financial ETF FAS, able to blow right past the line in the sand with no problem. A repeat of July-August seems to be in the making as I have noted 1-2-3 set up. Look for financials to bully back next week up to the declining 15 day sma, before the real fireworks begin. The bulls time is about up.
Today OIL gave us sell confirmation that we talked about last week. The DOJI candle followed by a long down day selling pressure sets up the pull back. CCI(30) is still in an uptrend, so for now we are looking to see what happens at the 38% retrace line in the sand. We should expect a bounce at that level.

Tim Kathlina

Wednesday, November 16, 2011

Nov 16th After The Bell Review

This continues to look like a distribution pattern, not a consolidation. This Friday will be 45 days since the 1st wave low in October and could be a significant top. Notice I have posted Buy and Sell signals as identified by SARS; which is a derivative of the RSI indicator. Also notice the downtrend channel that is forming with lower highs.
As noted in yesterdays post, COPX did break down and confirm a sell signal with the black candle stick that moved lower all day; breaking the line in the sand.
The CCI(30) indicator for SPY is forming a rolling top. We still need confirmation of trend, so caution is still in order.
Here we have the SDS, which is short the S&P. Today we have a SAR buy confirmation with a high wave candle that has taken out previous congestion. CCI(30) does not confirm the uptrend yet.
Question: Are emerging markets front running the US? Or can the US markets move higher as emerging markets slide? EDZ is short emerging markets etf. It is the strongest of the shorts and has moved right up to the line in the sand. Will this take out this line and confirm an uptrend??? If so, the play is to buy the dips as THE TREND IS YOUR FRIEND.
DPK seems to be front running the US and giving strong indication of a tripple top breakout; which is bad for stock bulls and good for bears. (In case you were not aware)
Tim Kathlina

Tuesday, November 15, 2011

November 15th Before The Bell Review

We are looking at COPX-Copper Miners. Every bull market has a copper top. This week is a significant event in price and time squaring. The shares moved 60 day high to low and have now retraced for 45 days to $14.11. Forty-five days is a significant price in time and to close around the 38% retrace in that time is significant. Considering the Bearish Harami pattern right at the price/time window, we expect a potential resumption of the downtrend and by extension the broader markets as well.

A lower probability exist that this is a significant low in price/time window, resulting in a major breakout to new highs. Should this lower probability occur, we can expect the move to exhaust at the 60 day mark from the low or around the 1st or 2nd week in December.


Wednesday, November 9, 2011

November 9th After The Bell Set Ups

Amount of shares short has plunged. This means no automatic bid/floor under stocks for now.
They say every bull market has a copper top. Here we are looking at copper etf JJC. The picture is not looking good for bulls and much work will need to be done to keep JJC and by extension the broader indexes. JJC has already moved out of its symmetric trend by pulling back beyond the 38% retrace of the 2009 low. Heavy downside distribution volume and CCI(30) indicate a confirmed downtrend. JJC has formed a symmetric triangle; odds favor a break out below and taking out the last line of defense at $40. Currently oversold on daily RSI(2) at 4.15.


Tuesday, November 8, 2011

November 8th After the Bell Trade Set Ups

The CHINA 2 verses 10 year curves are beginning to invert, pointing to a sustained and protracted economic recession in CHINA.
Looking at the CHINA Direxion 3xs bear etf: symbol YANG. We show the move to be in a confirmed uptrend as noted by CCI(30). Even though today was down, the CCI(5) moved back above the 100 line from an oversold position. Also note the Bullish (Doji) Star Pattern from today which indicates the downward energy is dissipating, The megaphone upward move suggest a recovery to challenge the 1st wave highs.
The price of oil has made and impressive 30% ramp off the bottom in the month of October. The oil short etf SCO on the weekly chart has now moved under 2 on the daily RSI(2) trade indicator. Historically, we can expect this trade to reverse sharply and outperform over the next week or more. Stocks move in 5s and 0s time frames; expect SCO to hold $40 and move higher. A severe drop in oil will also most likely indicate a top in the broader DOW and S&P indexes for some time to come.

Gold miners etf NUGT is showing multiple signs of exhaustion. Notice today we have a bearish Harami: The Bearish Harami Pattern is a sign of a disparity. “Harami” is an old Japanese word for “pregnant”. The long white candlestick is “the mother” and the small candlestick is “the baby”. This shows the bulls’ upward drive has weakened and now a trend reversal is possible. False breakouts are common patterns; notice the false break in July. CCI (30) indicates an extreme deviation from the standard moving pattern. Short below the upper black line, expect the miners to fall back into the defined trend range.


Monday, November 7, 2011

November 7th After The Bell Stock Trend Set Ups

Gold continues it's melt higher:
Gold is still in an uptrend noted in the CCI(30). RSI<2> and CCI(5) indicates an overbought condition. Candles have not given a loss of mojo signal-but note the August drop. GOLD tends to not provide a signal. Extension above upper Boilinger suggest setting a tight stop or harvesting profits.
GOLD short is in confirmed downtrend (noted CCI<30>). The divergence noted in RSI(2) verses todays closing price, indicates a potential snap back trade. Take down half position now, 2nd half after lost mojo signal in candles. Because this is downtrend-this is snap-pop trade only. Thus expect the trade to be exitied within 1-7 trading days with tight stop.
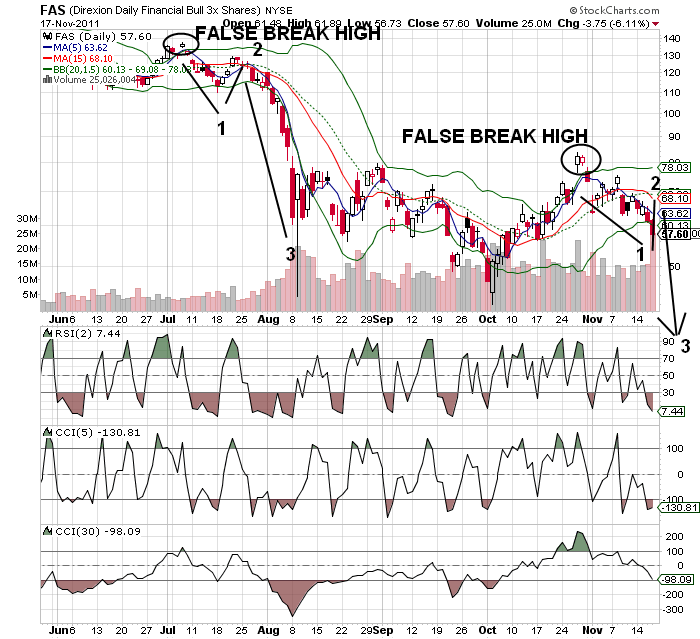
Financial Sector closed with a 5/15 bear cross-and Bearish Harami Pattern. Close outside upper bollinger, suggest potential move to lower end of the range. Since CCI(30) still is uptrending; the trade is a short below $13, expecting to cover within 1-4 trading days; tight stop above $13.10.

OIL closed outside BB today. CCI(5) showing a negative divergence. RSI(2) at 95, historically suggest underperformance in the week or weeks to follow. Because in confirmed uptrend, with no loss of mojo in candles apparent, take 1/2 half short position now, with cover stop above $26.
These are the best high probability/low risk sets ups for November 7th. Set-ups can take 1 week to play out.

Tim Kathlina