Thursday, February 2, 2012

BEFORE THE BELL-LOOKING FOR CONFIRMATION UPDATE FEB 2ND

Let me preference this write up by saying I approach my charting objectively. I do not watch CNBC or any other stock program. No matter what the stock market did on any given day, I view my charts with NO EXPECTATION.

I review a list of 50 ETFs and 10 Name Brand Stocks daily.

The following ETF's are major pillars of stock market bull success. To confirm a rally and be confident, these ETF's should also confirm.

I. DDM-Proshares Dow

A. So far in the new year, we can clearly see a ramp on volume compared to the previous months. This ramp in volume as resulted in a LOWER HIGH for DDM, a black spinning top today, in what I am sure was a praised BULL DAY on the TV Shows.

B. The 20 day moving average is closing fast the gap created by Santa

C. RSI<2> is making lower highs

D. On Balance Volume, which measures the positive volume on up days, verses the negative volume on down days, has COLLAPSED below its 20 day moving average.
II. IYT Transports

A. Bookend Change of Direction DOJI has emerged

B. Lower Highs RSI<2>

C. OBV remains positive

D. Consolidation or Distribution at the Volume by Price Indicator-yet to be determined

III. OIL ETF-daily

A. Oil and the DOW have diverged. They were both moving same direction until 2012. Which is correct?

B. OIL weakness despite the drum beat of war with IRAN-signaling a resumption of bad economy and lower demand

C. Extremely bearish deliberation moving below previous volume by price support

D. Volume by price is confirmed resistance now

E. OBV collapse

IV. OIL ETF-weekly

A. Suggested distribution box that began in late November; currently 3 months strong.

V. SSO-S&P Ultra daily

A. On a big rally day, SSO formed a Bearish High Wave-loss of direction. This was formed as a lower high.

B. RSI lower highs

C. OBV 20 day gap has been closed.

VI. TMF-20 year T-bill

A. Divergence from Dow

B. Double top formed between Jan 17th and today.

C. Despite stock rally, Bearish Harami formation

D. OBV move above 20 sma denied

VII. UST-7 and 10 year Treasury

A. Divergence from Dow

B. Bearish Harami

C. OBV has collapsed

Conclusion:

Next week is 180 day completion on 360 yearly cycle. Yesterday I noted on Twitter many Parabolic Sar sell signals. Today, these charts again provide NO COMPELLING REASON to be long the major indexes.

Therefore, our strategy of long HIGH RISK mojo stocks like NFLX and potentially CROX and GMCR, along with slowly averaging into TVIX for the eventual market sell off continues. (Side note, RUSSIA is looking good as alternative investment to USA)

Tim Kathlina


Wednesday, February 1, 2012

BEFORE THE BELL-CROX UPDATE FEB 2ND

On Jan 18th I posted this chart of CROX with a Bull Engulfing Pattern. At that time I suggested setting a purchase price above $20; with a sell target of $26.
Crox then moved into a sideways distributive pattern, which has lasted 13 days. Standard wave 2 retrace distributive patterns are 5 to 11 days. Crox moved higher out of this pattern on day 14, confirming the bull engulfing 2 candle set up; making this pattern more likely consolidation verses distributive.

Further backing the bull case is volume by price support above $18 per share.

Weekly shows the exhaustive spike down, followed by many weeks of consolidation of this spike. On Balance Volume indicates a positive divergence beginning in late October that continues to gain strength and is now up trending above its 20 day sma.

Conclusion:
I continue to believe the bull case for CROX. Once shares cross the Pivot resistance around $20.50, it should be an easy climb to the 50% Fib retrace area around $25.

Should earnings come in Feb 20th well above expectations, the share may well be looking $25 in the rear view mirror quickly.

Tim Kathlina

BEFORE THE BELL--Day Trade LONG BULL Set Ups for Feb 1st

Q: Sets up for day trading-How do we select them?

A: When in BULL market mode, we look for typical BEARISH patterns for long day trade set ups.

Q: Why Bear Set Ups

A: In BROAD INDEX BULL times, we expect BEARISH set patterns to fail. In other words, shorts who don't believe have jumped on the bear chart, but since MARKET BULLS out number BEARS, the PULLBACK is viewed as a BUYING opportunity by the larger volume traders; in this case bulls.

Q: What does Kathlina Scale Measure

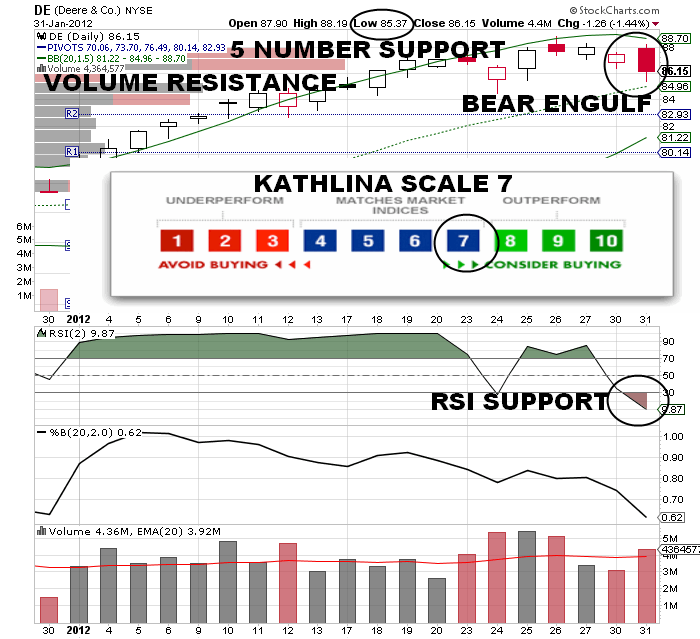
A: This is my own scale that assigns a number value based on a stocks current price verses its 30 day average; also factors in supporting case indicators such as RSI or Volume.


PIVOT 10.23 S1 10.02 S2 9.88 R1 10.37 R2 10.58


PIVOT 28.74 S1 28.12 S2 27.77 R1 29.09 R2 29.71


PIVOT 86.57 S1 84.95 S2 83.75 R1 87.77 R2 89.39


PIVOT 26.50 S1 26.20 R1 26.72 R2 27.02


PIVOT 22.59 S1 21.76 R1 23.04


PIVOT 3.66 S1 3.41 R1 3.84


PIVOT 15.72 S1 15.32 R1 15.94


PIVOT 38.88 S1 38.46 R1 39.13


PIVOT 56.47 S1 55.61 R1 57.14


PIVOT 29.13 S1 28.62 R1 29.75


PIVOT 36.49 S1 35.89 R1 36.95
Conclusion:
Many different ways to trade these set ups. I have provided Pivots and Support/Resistance opening figures under each chart. These figures have to be updated every 1hr of trading or the data is not correct.

Don't trade against the market or the 10year bond yield! (As example if market turns down, then these patterns likely to hold and be decent shorts. For now, market indicated higher, thus these make potential short cover longs)

Good Luck

Tim Kathlina


Tuesday, January 31, 2012

Before The Bell-CHINA Update YINN Jan 31st

On January 10th I posted this chart of the CHINA Bull ETF YINN and recommended taking a long position.

The bullish recommendation was based on a Bloomberg report indicating that China's stocks regulator will begin pushing pension funds and housing funds into the capital markets.

On Balance Volume also backed up this trade with a parabolic upside move; indicating some insider knowledge of this government action before the press release.

My Jan 10th conclusion read:
Just like with the US Fed QE and Twist Interventions, in the short run, some upside easy money can be made. Just don't stick around the after party celebration too long.

Here is a weekly chart of YINN as of the close Jan 30th. The stock has moved 30% in our favor since Jan 10th.

Notice the horizontal line drawn from left to right, clearly identifies the previous support level at $25, now resistance until proven otherwise.

The daily chart is showing a Bearish Harami, I believe this pattern will be denied today. The %B indicator is diverging, and the over all pattern of trend is down.

Conclusion: Recommend taking the 30% profit by the end of this week; I believe the broader downtrend pattern will hold and CHINA will once again resume its downward trajectory.

Expect the shares to reach $23-25 range, but doubt their ability beyond that. I am looking for a failure at this level, and will look to get short CHINA once confirmed.

Tim Kathlina

Saturday, January 28, 2012

AFTER THE BELL-S&P Update Jan 28th

From Yahoo Jan 27th:
Quest for the golden cross
By Rodrigo Campos
NEW YORK (Reuters) - January has turned out strong for equities with just two trading days to go. If you're afraid to miss the ride, there's still time to jump in. You just might want to wear a neck brace.

Bullish write ups like this are what tops are made of. The S&P is up 14% last 9 weeks. VectorVest universe of 8000 stocks now trades well north of 43xs P/E. (Very expensive)

On Dec 23rd SPY update, I reiterated my price targets set in early December by stating:
Conclusion: My forecast for 1290 to 1320, although many times in December looked improbable, remains. The forecast remains not because stocks should be going up, they should not be (Look at ORCL earnings miss, 1st in 10 years), the forecast remains because the technicals have not changed.
 
Lets look at where we are now
SPY weekly chart I have marked potential Elliott Wave counts. The 1st 5 waves up, followed by irregular a-b-c correction are easy.
 
The next 5 waves are yet to be determined, but this is the count I am going with for now, which has the SPY uptrend completion between the current close of Friday 133 and the 1st R1 area of 138.

The next two charts are to validate the above chart; indicating that the 5th wave is completed.

If we take on the weekly chart the bottom of Wave 1, to the top of Wave 3, its 31points. 5th waves tend to equal .61 of other waves. If we take the bottom of the 5 wave, add in 18 points we come to a price target of 133.

Lets take the daily chart to try and get a price target. The daily chart has an inverted head n shoulders pattern. Calculations for IHS patterns are head to neckline added to neckline. Using this formula, same price target of 133.

Next lets look at length of time. Counting from October low, we are coming into the 180 time frame from the low. The divisible numbers by 3 are strong point and time areas to look for tops and bottoms. So anytime between now and Feb 8th is a strong place for market turn.

Conclusion:
Current evidence of price and time, both on weekly and daily charts point to a 5th wave EW completion between Jan30th and Feb 8th.

Square of 9 calculations using Fridays closing price shows a GANN sell signal at SPY 129.39. A strong close below this price; coupled with increasing volume and within our 180 time frame; should seal the deal.

Until you see these numbers play out, taking down any high leveraged short ETFs other then ones tracing the $VIX is not advised. The reason we average into TVIX down here, AND ONLY TVIX, is because the $VIX tends to have defined lows, no matter how high the market goes.

Tim Kathlina


Friday, January 27, 2012

REVIEWING CANDLE PATTERN-BULLISH KICKER JAN 27TH

This morning on Twitter, I indicated what I believed to be a potential Bullish Kicker setting up in shares of TVIX. However, it was not to be as the pattern was defeated by market bulls just as the opening bell rang. (Dummy me already took the bait pre-market. Let that be a lesson to you kids, wait for the open tic to confirm) Afterward I thought lets run thru some random charts and show you what a Bullish Kicker looks like, and just how powerful and profitable this pattern is.

Basically you can spot a bullish kicker by a white candle opening that gaps completely above the previous down candle's entire body. Look for at least 2 to 3 new low red/black candles prior to the up gap open. This pattern is easy to anticipate pre-market. It's a very powerful pattern because it causes shorts to cover and brings in new longs. This pattern usually kicks off a good bull run.


Apple gave us a Bullish Kicker right at the 200 day sma-FANTASTIC! Bullish Kicker is highly reliable, but with another confirming signal its like having your cake and eating it too.
Two Bullish Kickers in INTC to confirm the uptrend. One to start the upswing, second one right at the 50 day sma-FANTASTIC!


Microsoft again bull move signaled by Bullish Kicker. Bull moved confirmed once the stock consolidated at the 200 sma average, which then became support.
RIMM gave you a chance to go both ways. First a clear Bearish Kicker with confirming signal of overhead down slope 50 day, then Bullish Kicker reversal that lead to 30% profits on the upswing. FANTASTIC!

Sears Holding-Another one from our NAME BRAND STOCKS THAT GOT KILLED trade list. These are the best stocks because, many hedgies and pensions are involved, so they are backed by big money.

Holding out for the Bullish Kicker pattern got you in safely at the very bottom for a nice, and very predictable run up to the 50 day down slope sma. This Bullish Kicker also came with a Bull DOJI. FANTASTIC!

Conclusion: The Bullish Kicker is a very powerful pattern that often begins a new bull leg or confirms a mature bull move.

This pattern is easy to spot for 1st year traders and can be anticipated pre-market. Being comfortable with this pattern, will give you the comfort to buy up gaps, that might otherwise emotionally be difficult to purchase. Many people have a hard time buying big opening up gaps, they feel as if the move was missed.

Bullish Kicker up gaps, often signal the very beginning of a powerful bull move.

Tim Kathlina

Tuesday, January 24, 2012

After The Bell-GOLD Trade Update-Time To Sell Jan 24th

On Dec 14th 2011, I posted this chart of Gold and suggested it was time to go long the metal, buying the exhaustive dip at the $153 level. I also indicated the climb up would be at least 9-13 days in length.
On Dec 14th I posted this chart of GLL, which is short Gold etf, and suggest a good way to play the rise in Gold would be to short GLL at its 200 day sma around $20-21, betting the shares would fall as Gold rises.

Here is a chart of the etf GDX today, which is the Gold mining companies. GDX formed a perfect Head-n-Shoulder top, confirmed when the shares broke the neckline downward. Notice the reaction/action of this break was to find buyers, move back up to the neckline, creating a failed retest as it moved lower again.

We take the length of the Head to the neckline, and add that to the bottom of the neckline to get our price target, which is around the calculated support level around $45.

Here is Gold GLD chart today. GLD has reached the top of a down slope channel. We recommend exiting this trade asap.

Finally, here is today's GLL chart. The stock has moved down nicely from the recommended short of $20, and now is touching calculated support at a rising uptrend line. We recommend this trade be covered asap.
Conclusion: GOLD seems to have found a near term top, thus we recommend taking off the Dec 14th trade of going long GLD and/or shorting GLL.

The patterns suggest GOLD will begin a fast down thrust to the lower channel, which should only take 6-10 trading days. However, if the FED signals QE3 or some derivative of, then these patterns could be broken.

We advise locking in these profits, then waiting until the next market signal direction appears. I did hear that Dennis Gartman is long Gold now, so for sure I expect the pattern to hold and Gold to decline; he is a great contrary indicator.

Tim Kathlina