Wednesday, January 4, 2012

After The Bell-S&P Target Update Jan 4th

On Dec 16th I used pitchfork analysis to indicate pattern of trend for SPY and my low side price target of 1290.
On Dec 13th amidst much negative press I used Gann time analysis to indicate an upside minimum price target of 1290 to 1320 to be completed in January 2012.

On Dec 21st I used volume by price to show current overhead supply resistance and hypothesized that this would soon become support; restating my price target minimum of 1290 to 1320 to be completed in January 2012.

Today Jan 4th, a day that started lower again on negative news, ended up being very constructive for the bull case. The last two candlesticks have formed a Bullish Piercing Line Pattern. This pattern is defined as: 
Bullish Piercing Line Pattern is a bottom reversal pattern. A long black candlestick is followed by a gap lower during the next day while the market is in downtrend. The day ends up as a strong white candlestick, which closes more than halfway into the prior black candlestick’s real body.

Notice volume by price has now become a support area; as speculated on Dec 21st.

Using Square of 9 calculator expect SPY up side resistance at: 129.39, 132.35, if real bullish 135.14. These target areas will bring about the extreme bullishness required to put in a solid top.
Just for confirmation sake, I have included the DIA etf, which tracks the DOW JONES 30. DIA formed a Bullish Engulfing Pattern, which is defined as:
Bullish Engulfing Pattern is a pattern characterized by a large white real body engulfing a preceding small black real body, which appears during a downtrend. The white body does not necessarily engulf the shadows of the black body but totally engulfs the body itself. The Bullish Engulfing Pattern is an important bottom reversal signal.

Conclusion: Despite a very choppy and difficult Santa Claus December, filled with many fits and starts, my price targets remain the same. Even though the world wide data and news does not support the targets, and many times on big down days the targets looked in doubt, technically we did not get any signal to change our position.
Stock trading will always try and shake out both bull and bears with extreme fear and greed. It is very difficult to stick with a position as your resolve will be tested many times before getting paid.

Tim Kathlina

Tuesday, January 3, 2012

After The Bell-NETFLIX-Brand Names Beat Down List Update Jan 3rd

NEW YORK (TheStreet) -- Netflix(NFLX_) is ramping up its original content, announcing the premier of the series Lilyhammer in February

We keep a list of beaten down Brand Name company stocks, these make the best turnaround 1000% gainers. NFLX has had a tough year based on one simply ill advised move by the CEO to try and unlock additional shareholder value, by separating out the dying, but very profitable DVD business from the future streaming business.

As a personal note, I don't own a DVD player, but am a Netflix subscriber. I get my NETFLIX via Roku2 box. The Roku box has 400 apps on it and works over a wireless Internet connection. DVD is a thing of the past and will go the way of the VCR.

NFLX daily chart is noted on the left volume by price. What we are looking for is evidence that the drop from over $300 a share to $70, represents a good value to someone with enough money to support the shares. It appears that $68, has proven to be a line in the sand for institutional investors.

Notice at $68, the largest volume of transactions have taken place. We can now count this as support because the shares have tested and held this level 3xs. It appears that supply is being absorbed at this level.

Second notice the Slow Stochastic did a negative K/D cross 2xs in December, but $68 price level held.

Looking at Call Option Open Intrest for the January 20th expiration, the largest amount of contracts is at the $82 strike price level; which on the Daily chart is around the R2 calculated price. This call option strike is trading up almost 40% today.< http://finance.yahoo.com/q?s=NFLX120121C00080000 >


Daily chart, possible breakout above $73
 Here we have the weekly NFLX chart showing calculated upside targets. Should the trend change hold, one can expect the 1st stop to be around the $110 level, mid-range of Boillinger Band. With ultimate destination $200 or more.
Weekly Chart, long term retrace potential
Conclusion: NFLX seems to offer a good trade option in the short run, month of January, for some fast profits.

Long term, it will take time to win back customers and gain traction on overseas expansion. However I feel like the shares are the future of streaming TV and expect NFLX to achieve a BIDU or GOOG type lofty status with investors. I'm am averaging into NFLX slowly, using monthly dips as buying opportunities.

Tim Kathlina

Sunday, January 1, 2012

After The Bell-The FED and 2012 Stock Market Jan 1st

Sept 22nd 2011--NEW YORK (CNNMoney) -- The Federal Reserve announced "Operation Twist" Wednesday, a widely expected stimulus move reviving a policy from the 1960s.

So, how are all these Fed programs working out for Americans?  Lets look at the data:
Americans begin going back to school and living off their credit cards to maintain standard of living


As Free trade agreements get passed sending jobs overseas and more money gets printed by the Fed causing food inflation, Americans can no longer afford to eat

The housing collapse should have had a reaction effect by lowering the cost of gasoline based on lower demand; however, the Fed money printing machine made sure while Americans went broke, rich oil executives continued to get paid more

As more and more laws and executive orders get signed limiting the constitutional rights of Americans in order to pump up the Military Industrial Complex, and the Fed prints more money pushing up cost, Americans lose jobs

Wars and Keynesisan Voodoo Economics push more people into despair

As more and more people get a college degree, taking on more and more debt, Americans incomes go lower and lower

To try and get a handle on 2012, we have to look at bonds vs stocks their reaction to Fed actions; then make a guess as to what the FED will do next.

Here we have TMF, which is the 20 bond bull etf, overlayed against the S&P. I have marked on the S&P the QE and Operation Twist beginning times. Its clear that without FED money pumping the S&P would have continued its collapse from the housing bust. What we also see is, when the FED takes foot off the gas peddle, the S&P begins to move lower, which is the natural order of markets reflecting actual real world economies. The FED is determined to go against the Laws of Natural Order. Its clear the FEDS mandate is to keep stocks up beyond all other objectives, and at all cost, no matter how destructive to the real world economy.

The latest Fed action, Operation Twist, has done nothing more then create a bear wedge in the S&P, a reaction to the action of a Head N Shoulders top. Notice TMF has closed outside its upper Boilinger Band and the ADX is signaling this extreme upside move in TMF induced by FED action is now beginning to change course. Same as with all other FED actions, the positive results are short lived and come with a long term destructive cost.

The TMV is the 20 year bear etf. As the FED continues to pull out his bag of tricks, the TMV suffers along with the American public. However, TMV is showing divergence of trend in RSI and is at a Bear extreme in ADX. Once again we are seeing FED action having a temporary effect that has about run its course, soon to move out of the way for the markets to price in reality.

The UUP represents the US Dollar. As the FED prints more dollars, the value of the product moves lower, by extension Americans standard of living. Notice QE1 as it runs its course, the effect on the dollar begins to lessen and natural order takes over. In other words, the dollar begins to price in inflation. The S&P does a Head N Shoulders pattern and thus triggers panic phone calls from Wall St to the FED. The Fed responds with QE2, sending Americans into further debt leverage abyss, but pumping up corporate profits and stock prices. Notice the same Natural Market Selection begins to take place, another Head N Shoulders forms and the dollar bottoms; more calls from Wall St to the FED, here you go, Operation Twist.


Conclusion: The path of total destruction of America and the constitution is set on a path of no return. The short term fix/kick the can will always be the path taken. Expect inflation and depression to continue to squeeze America until WW3 is finally declared. Expect QE3,4,5,6 until the final collapse.

Most of all, Natural Order will prevail. Expect markets to price in the reality of run away inflation, jobless, homeless and starving world populations, under Fascist dictator rule. Rome is burning once again and history is set to repeat.

Tim Kathlina

Tuesday, December 27, 2011

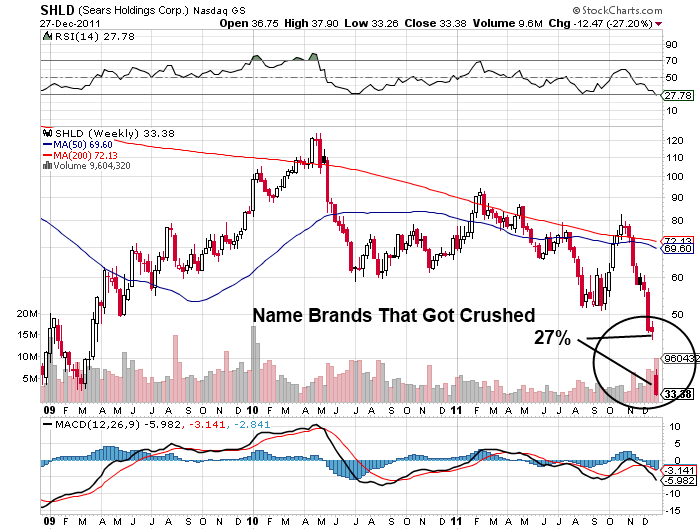
After The Bell-Name Brand Companies that Got Crushed Watch List Dec 27

Nov 2006 SHLD was $200 per share. Jim Cramer/Mad Money indicated this company was a mini Berkshire Hathaway and the stock was going much higher.

Today with a 27% beat down and shares no where near $200, we add this name brand into our Crushed Name Brands watch list. Recent entries include: American Greetings and Netflix.

Tim Kathlina

Thursday, December 22, 2011

After The Bell: Name Brand Stocks That Got CRUSHED-American Greetings

Many people understand bargain shopping; except when it comes to stocks. For some reason, the average person will buy a blender on sale, negotiate a good deal on an automobile, but when it comes to stocks, people will over pay every time. Everyone loves to look at a chart of a stock that has gone up 1000% over a few years, but nobody wants to buy that lower left, best price on the chart. Why-unlike other things, buying cheap stocks is SCARY! Scary because of what makes them get cheap: earnings miss, downgrades, etc.

What I do is create a notepad file titled: Brand Name Stocks That Got CRUSHED! A person can make a living as a value fund manager by identifying these picks, then giving them time, months and months, to finally panic out the most bullish of bulls.

Today's add is American Greetings. Here is VectorVest views on AM:

Company Information
Business: American Greetings Corporation, together with its subsidiaries, engages in the design, manufacture, and sale of greeting cards and other social expression products worldwide. It offers everyday and seasonal greeting cards, gift wrap, party goods, calendars, stationery, gift ware, and custom display fixtures.

Capital Appreciation
Value: Value is a measure of a stock's current worth. AM has a current Value of $20.78 per share. Therefore, it is undervalued compared to its Price of $13.23 per share. Value is computed from forecasted earnings per share, forecasted earnings growth, profitability, interest, and inflation rates. Value increases when earnings, earnings growth rate and profitability increase, and when interest and inflation rates decrease. VectorVest advocates the purchase of undervalued stocks. At some point in time, a stock's Price and Value always will converge.

DY (Dividend Yield): DY reflects dividend per share as a percent of Price. AM has a Dividend Yield of 4.54 %. This is above the current average of 1.46% for all the stocks in the VectorVest database.

Recommendation (REC): VectorVest gives a Buy, Sell, Hold recommendation on every stock, every day. AM has a Sell recommendation.

Conclusion: AM is most likely just beginning a 5 wave down move that will cut the shares at least in half from here. Currently with only a 500 million market cap on 2 billion revenue, paying 5% div yield to hold the stock, when the average yearly market s&p return is 7%, this play is a winner. Downside price targets can be projected, once we see this 1st leg down. Until then we keep it on our list, like a Christmas present in waiting.

Tim Kathlina

After The Bell-Before The Bell SPY Update Dec 23rd

On Dec 18th I identified the correct uptrend for the SPY using Pitchfork analysis. At the time, the market bears looked like they were going to give the bulls a knock out blow with no Santa Rally.
On Dec 13th I used price and time counting to project an upside target and date. At the time, again bearish news headlines ruled the day.
Today we are focused on a 1 month chart of SPY, to help support or deny my previous post. When forecasting, its important to check your list twice, use multiple time frames, multiple indicators and re-check often.

On this chart I included volume by price bars to the left side of the chart; we are concerned with the longest bar. Stock trading is about price discovery, where is the balance between buyers and sellers?

The longest bar is at the 124/125 level. In early December, this area of supply won the day moving the shares lower. Negative headlines, along with the 200 day moving average proved too firm of resistance for the bulls.

The question is: will supply overcome demand once again? Please do not under estimate the bulls ability to run the SPY up to my previous price targets, once able to move past an overhead supply area. What was resistance quickly becomes support when the area is broken to the upside.

OBV is trending higher. The strong move up starting Dec 14th.

The largest open interest for call contracts for January is 130, right around my price target - noted Dec 13th. Options expiration is too far out for this to be a factor; but stocks tend to gravitate towards option prices that make the contracts worthless.
Conclusion: My forecast for 1290 to 1320, although many times in December looked improbable, remains. The forecast remains not because stocks should be going up, they should not be (Look at ORCL earnings miss, 1st in 10 years), the forecast remains because the technicals have not changed.

Despite the rest of the worlds stock markets already in a bear, the USA extend and pretend continues on for just a little while longer.

This is not a recommendation to buy the SPY, just a forecast for a top. On the contrary, I would be running from bull positions as fast as possible. One bank failure and its all over.

I am averaging into TVIX.

Tim Kathlina

Wednesday, December 21, 2011

After The Bell-Time To Buy Insurance Against 2012 December 21st

I have noted prior my expectation for a impulsive major bear wave 3 down move to begin in January 2012.

It is my intention to begin accumulating insurance protection against the bear move in the form of ETF's that track 2xs or more the VIX-Volatility index. Based on the charts below, I feel the time to begin taking a position is now.

This first chart is the inverse VIX index, symbol XIV. This ETF moves higher as market participants become more and more complacent and comfortable with the world and stocks. I still find it hard to believe after the daily deluge of failed government attempts to put lipstick on the finance pig, stock investors are feeling giddy; according to XIV.

Putting that aside, closing outside the upper BBand, RSI2 over 99, is always a sell signal.

The next two charts are the opposite. The TVIX and VIXY move up as the investor fear level rises. With the world on the verge of collapse, one would think these stocks wouldn't be performing so poorly.

History is repeating: crash of 1929, crash of 1987, dot.com bust of 2000, housing bust 2007, Bear Stearns and Lehman collapse 2008. Today, same as all the other times, the Tulip Bulb Ponzi stock investors, are the last ones to figure things out.

Conclusion: If the market tops now or 5 months from now, the technical picture for buying insurance protection has never been better.

Time to average into these TVIX and VIXY plays every week or other week until the musical chairs, ponzi stock market catches up to reality.

Tim Kathlina